
CSPR Long Term Predictions
CSPR Price Forecast (10 year): We will show how using 2 models, we can estimate a long term future CSPR token value of $105 per token.
Consideration before reading
Before continuing, I wanted to warn that some of the predictions using the models give truly phenomenal future values across the crypto space. The best way to digest these figures is to consider how the networking effect (to be discussed) would value the current internet. The value would be beyond anything seen in humanity. This is purely because throughout the course of humanity there has been no prior interconnection of individuals like we see today. The internet was a true game changer and is how companies such as Facebook, Google, Microsoft and Apple have monetised this via either adverting and data gathering or via access to the internet. Subsequently these companies have ballooned in valuation. The networking effect (Metcalfe’s law) will be approximated to show that the value of crypto currency is actually the measure of this networking effect. This is something which doesn’t exist at present when consider the internet or an intranet. We will conclude with a $100 CSPR long term value, but this is primarily driven by the predicted explosion in crypto valuations. What we also argue (from other articles) is that even throw there will be a systematic grown, there is also substantial relative value growth in CSPR.
Introduction
In this article I will try to summarize some of the points laid out in the Macro Insiders long term bullish view on Ethereum – why they believe its market cap will surpass that of Bitcoin’s – and state why we think if this plays out, a better bet is to actually invest in CSPR. The reason being that we currently have an entry into CSPR at a very low level (with a market cap of <$100m) and as stated in some previous articles of ours on casper specific opinion, and technology comparison between ETH and CSPR, we expect the future state of POS blockchains to be dominated by ETH, but with CSPR also holding a substantial share of the market. Therefore the upside on CSPR is greater than that of Ethereum, from this point. The reason we feel CSPR will hold a substantial share of the future market is discussed in some of our other articles where we cover things such as:
- Potential future regulatory shocks: How CSPR is proactively addressing these early by considering AML and KYC solutions which will aid enterprise adoption, covered here.
- The core technology of the protocol, cover in our CBC and Highway prototcol.
- The fact that CSPR’s successful implementation of Casper CBC, positions itself to be an effective testnet for future ETH 3.0 development. Meaning that it will naturally pull development from Ethereum projects looking to get a head start on their ETH 3.0 dev and exhibit a similar behaviour seen when currently analysing KSM and DOT.
- The fact that CSPR is a standalone blockchain, unlike KSM – where we can argue that if DOT fails, so will KSM, however if ETH fails (or delays upgrades further), will drive even stronger CSPR adoption.
First we will look primarily into Bitcoin and Ethereum to find working models. We shall then apply these to CSPR in order to highlight why there is exceptional long term growth expected. We shall cover:
- Stock-To-Flow models for both Bitcoin and Ethereum
- Crypto valuation using Network models
Stock-To-Flow Model
Stock-to-flow (S2F) is one of the simplest ways of measuring the abundance of a particular resource. The Stock to Flow ratio is the amount of a resource that is held in reserves ( i.e. available at a given point in time), divided by the amount that is produced annually.
- For a store of value commodity like gold, the stock being added (mined in this case) is not consumed. Therefore the availability is continuously growing. This means that as each year passes, if the produced amounts remain constant, less is added to the market as a percentage of the current market.
- This is unlike a commodity like oil – where what is being produced is actively being used, with stores of oil typically account for a smaller component.
A higher ratio indicates that the commodity is increasingly scarce. Less stock is entering the market as a ratio of the total market as each year passes. Therefore this is more valuable as a store of value.
Bitcoin
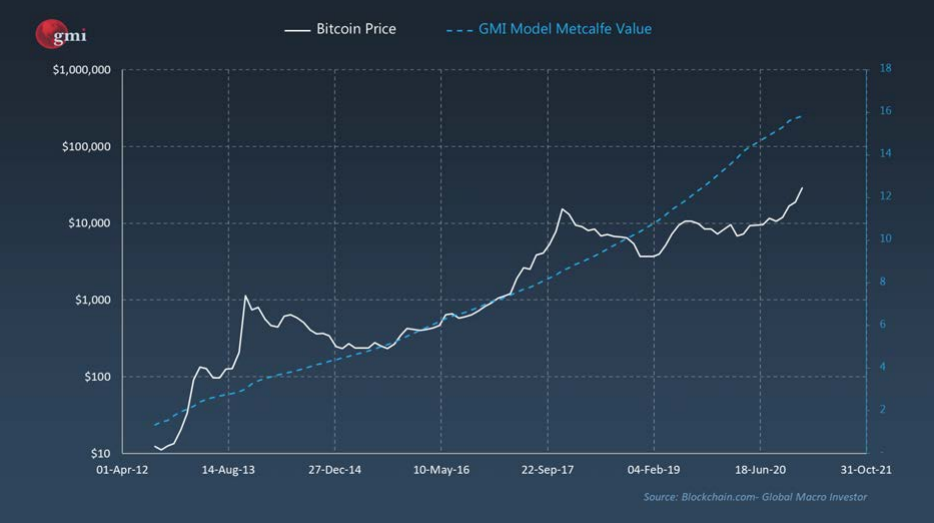
The below illustration has the BTC price history overlaid onto the STF chart with a projection on the STF into the future (we can project out as we know the approximate mining schedule of BTC). Source of chart here.
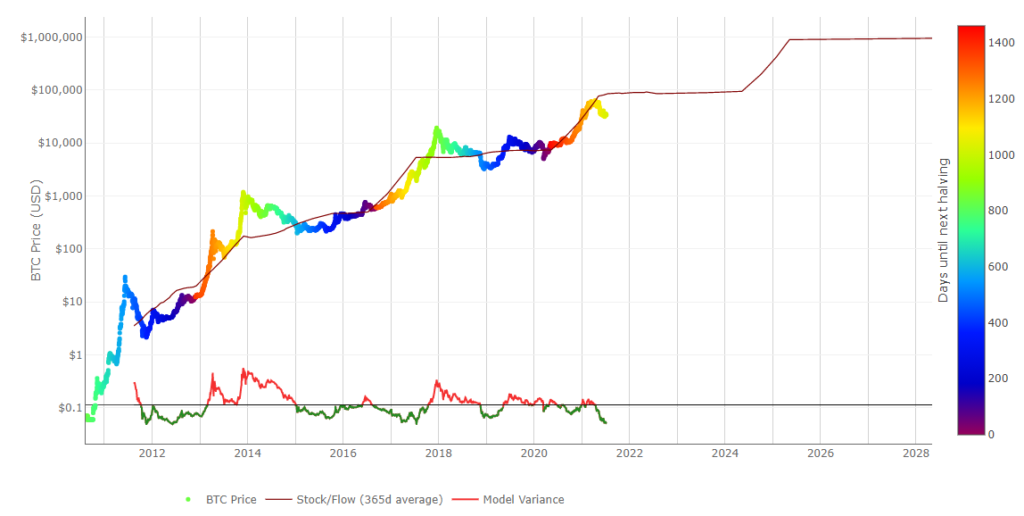
Its intuitive why BTC follows this path due to the scarcity of the token and therefore the fundamentals behaving more like a store-of-value commodity. We can therefore clearly state (as per this model), that we can expect prices of $100k BTC at some point prior to 2024. Also we can state that the recent fall in price has diverged from the S2F model and we would expect a pullback. Note the model does not predict if the near term prices will increase or decrease. It is still very possible that shocks to the system such as regulatory crackdowns may result in the price dropping in the near to medium term, however we can state with confidence, based upon the model and historical data, that likely any pullback will be temporary.
Ethereum
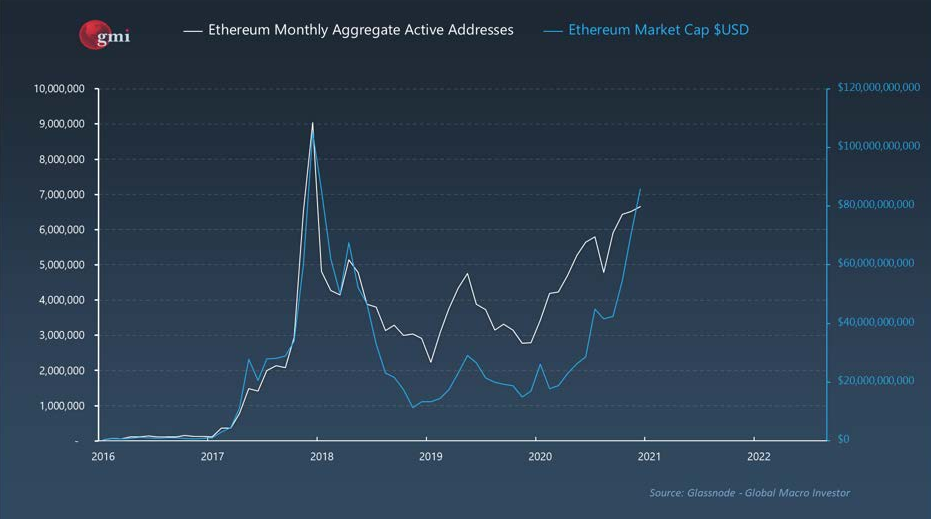
If we now also introduce the ETH comparison to STF and adjust the scale slightly, we can see that ETH also follows the same behaviour (chart source : Global Macro Insider’s ‘Deep Dive’ paper published 26-02-2021).
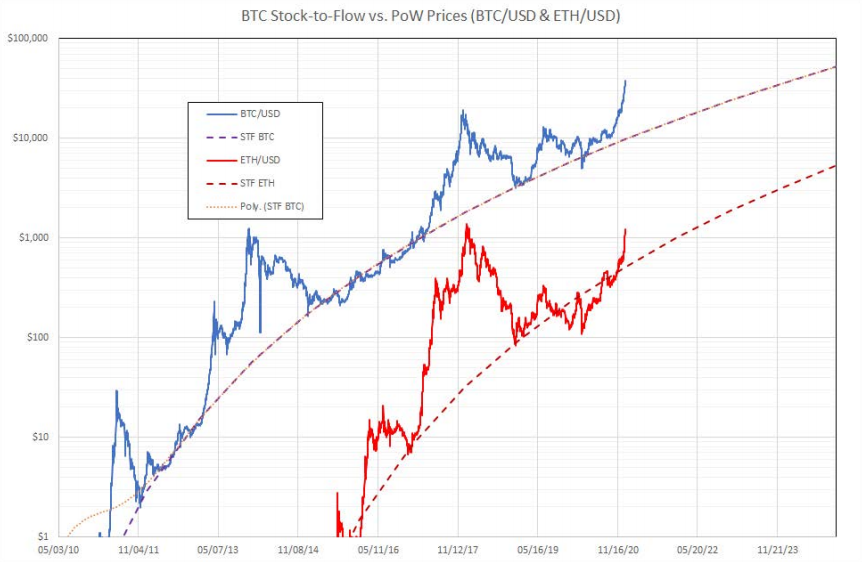
What is amazing to observe from the chart is that Ethereum is also closely following the S2F model. This is not intuitive as there is nothing intrinsic for ETH to behave in this way. Ethereum does not have a finite supply. We can maybe explain this however if we consider something called Metcalfe’s law.
We can state that the value being concentrated in ETH is derived almost entirely from a combination of its adoption (network effects – Metcalfe’s Law) and also the ease of moving between BTC and ETH; once you convert fiat to BTC, typically you do not go back to fiat often, however trade flow from BTC to ETH is more fluid because BTC is the incumbent blockchain which people usual buy when entering crypto. Only after buying BTC do they begin exploring alts such as ETH.
So what is Metcalfe’s law? Lets briefly cover this first….
Metcalfe’s Law
Metcalfe was one of the co-inventors of the ethernet and founder of a company which created networking cards. i.e. network cards that you plug into a computer giving it access to the Ethernet – a local network of shared resources like printers, storage and the Internet.
Metcalfe explained that whilst the cost of the network was directly proportional to the number of cards, the value of the network was proportional to the square of the number of users. Or in other words, the value was due to the connectivity between users, enabling them to work together and achieve more than they could alone. This intuitively makes sense as if there was no connectivity, the the cost is each network card. However as soon as connectivity begins the value is increased by each connection in both directions.
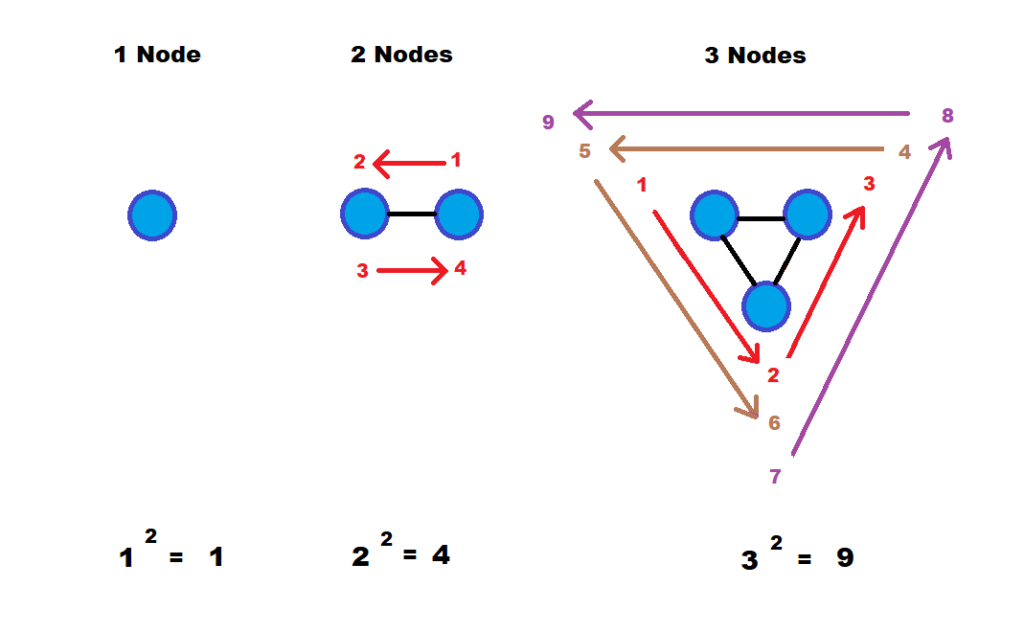
Metcalfe’s law explains how the value of a network grows exponentially. It states the value of a network is proportional to the square of the number of nodes in the network. The end nodes can be computers, servers and simply users. For example, if a network has 10 nodes, its inherent value is 100 (10×10=100). Add one more node, and the value is 121. Add another and the value jumps to 144. Non-linear, exponential, growth. Example below:
The more effective a network is at solving problems for its users, the higher network effect it can ultimately command leading to a higher demand and therefore higher price. Therefore market cap or price are just mechanisms of trying to solve for this utility which the token brings. There is a lot of noise however in price over time when trying to back out the value. It therefore more appropriate to measure adoption of a network as opposed to the utility it brings.
If we now look at the approximation to Metcalfe’s law….this is basically adoption. In this case we use Global Macro Investors model of active user addressees as the measure of adoption:
Bitcoin
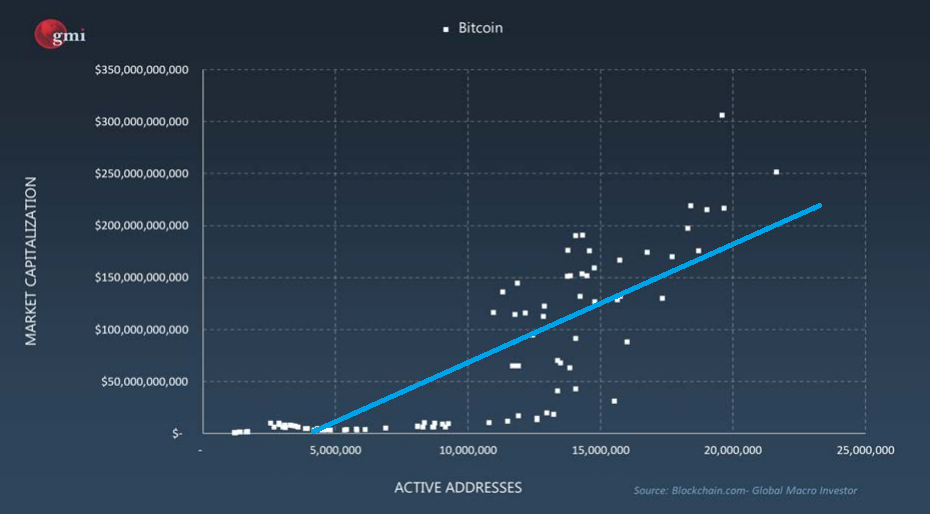
You will note from the above regression of active Bitcoin addresses to market cap, that there is a clear linear relationship between these two factors. Now, as big institutions come into the space with higher bitcoin allocations per account, you need less accounts to drive truly exponential moves, so there is a high probability that the curve goes ever more exponential. Therefore the regression should not be linear but more exponential. We now plot the addresses against price below with the exponential adjustment to the regression:
Ethereum
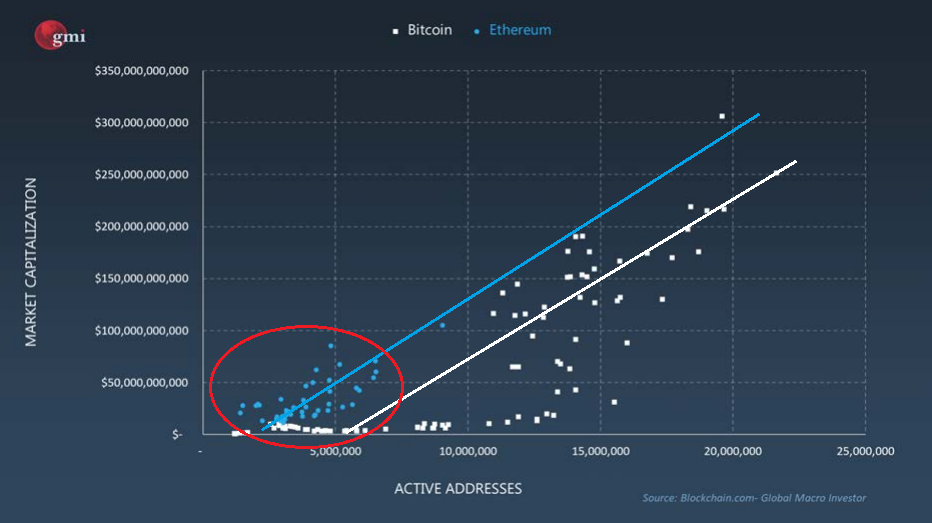
Now moving onto ETH there is a substantial correlation between active addresses and market cap, as can be seen below:
So Ethereum shows the same relationship of price to active addresses as Bitcoin (note bitcoin having more total addresses means the network effects would be large). If we look more closely into the comparison of the analysis between Bitcoin and Ether we can actually see that Ethers relationship is stronger in the earlier stages, meaning there is a greater inherent networking effect. Does this make intuitive sense? Yes it does, as Ethereum provides a utility which therefore should be a more important factor compared to Bitcoin. Additionally we can see from the data below, that for the same active users, Ethereum actually commands a higher market cap then Bitcoin! This is a big deal.
However, recall in a previous statement we discussed that there would be a tendency for newer Bitcoin accounts to hold on average a larger market cap, when compared to older accounts (due to the recent inflow of institutional money into the network). We noted that this would move the regression from a straight line to something potentially more exponential. We will therefore likely see the following where there will be a point where the relative networking effect of Bitcoin surpasses that of Ethereum. To forecast the extent of this is non-trivial. We can however make estimates on this and for the purpose of calculating some price forecasts we shall assume that for an equal amount of active addresses at some point in the future, the market cap of Ethereum will trade at a discount of 30% to Bitcoin.
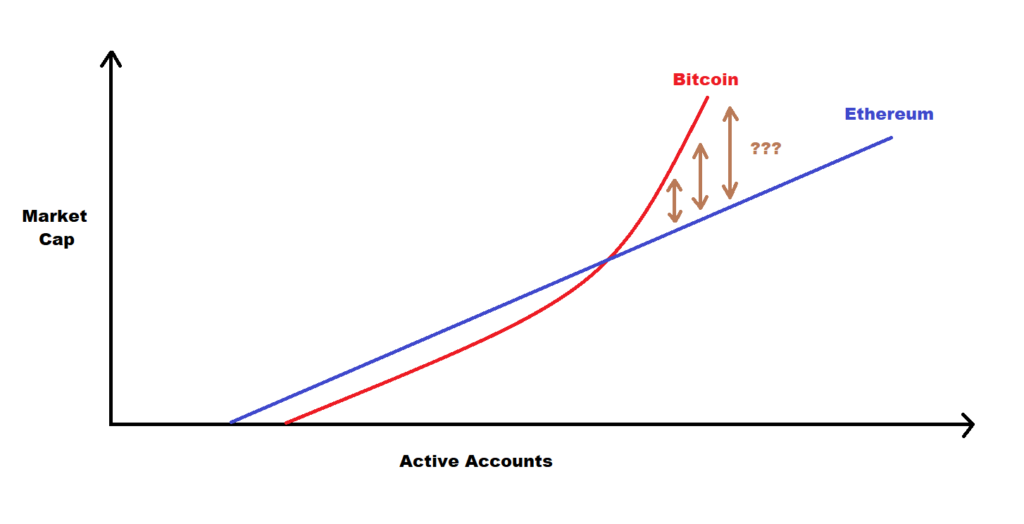
Greater adoption in Ethereum and related utility tokens will result in a greater market cap compared to Bitcoin with the same level of adoption up until a critical point. After this, the greater presence of more centralized institutional funds will favour Bitcoin.
ghost staking opinion
Now lets put some numbers to this. Note I have previously extensively argued why we believe CSPR will be a dominant blockchain in the future (you can read some of these arguments in our previous articles in the commentary section). For the below valuation we shall be using the following assumptions
- Bitcoin future value follows the S2F model
- The exponential networking effect of Bitcoin will result in a 30% market cap premium over Ethereum in the distant future.
- Ethereum will dominate the future smart contract blockchain space, comprising 60% of total market cap
- CSPR will be a dominant blockchain comprising 10% of market cap
CSPR Valuation
- S2F Bitcoin model predicts an eventual $1m coin value
- Total Bitcoin available 21m
- Implied BTC future market cap after all coin mined is therefore $21 trillion
- Metcalfe’s model suggests an approximate 30% discount on ETH market cap for a same level of Bitcoin adoption
- Therefore implied ETH market cap has the potential to rise to $14.7 trillion
- Assume ETH makes up 60% of the future smart contract market with CSPR holding10%
- This puts a potential CSPR future market cap at $2.5 trillion
- Assuming 10bn CSPR token supply this will value a single CSPR token at $250
Considering there is a consensus around a bitcoin future valuation of nearer $500k, to remain to the same degree of conservatism, we shall half the forecasted price.
Potential long term future CSPR price at $105 per token
Ghost staking opinion
Disclaimer
- Note, even though I have stated that there is an exponential networking effect on Bitcoin, this is more of a long term effect. In the VERY long term, this will exhaust itself with sufficient dilution and we may see a reverse in premium moving from Bitcoin, to Ethereum.
- As with any model, many assumptions are used here. The main ones being the qualitative assumptions that Ethereum will command 60% of the future smart contract market with CSPR commanding 10%.
- As with any model, the forecasts are only predictions. These predictions are based upon data we currently have and also known modelling techniques.
- There can be many shocks to the system that could occur at any point into the future. Things such as new technologies or more severe than expected regulatory impact could cause significant structural shifts and void the model.
- There is no near term expectations discussed in this article. Crypto is a highly volatile asset class which may result in significant near term losses.
- The article is written as a review of research and does not constitute financial advice.
Disclaimer: This article is written for the purposes of research and does not constitute financial advice or a recommendation to buy.
[…] submitted by /u/Opening_Cow_1783 [link] […]